http://isthereglobalcooling.com/about_the_author
Welcome. I will try to give you the answer to the question "is there global cooling?"
As you are well aware there is a huge effort around the globe to counter the alleged impact of mankind on the world's climate. If in fact mankind will cause the seas to rise appreciably by causing CO2 induced global warming then certainly let's do something about it. But, what if global warming is not what they say it is? What if the world's temperature is headed in the opposite direction? Global temperatures increased for twenty years from the late 1970s to the late 1990s but have actually been cooling the last eleven years. The global warming and subsequent cooling were even predictable due to hundreds of years of historical trends and observation of the impact of variations in solar activity on global temperature.
Did you know that in the past the Roman Period and Medieval Period were both several degrees warmer than today's temperature. The world then cooled at least four degrees from 1450 to 1850. This period was called the Little Ice Age (a period of glacial advance, the same glaciers that are in retreat today). These temperature variations were not caused by man. They were caused entirely by natural forces.
Quick facts about the U.S. and global climate
U.S. and global Temperatures are cooling
*October 2009 U.S. temperatures according to NOAA were the third coldest in 115 years of record keeping, 4 degrees below the average temperature for this month. link October 2009 also had the most snow in the U.S. than has ever been recorded for that month.
*Germany recorded in 2009 its lowest October temperature in history link. New Zealand had record low October temperatures and record late snows link
Siberia may have had its coldest winter in history in 2009-2010 link European and Asian temperatures in the winter 2009-2010 were well below normal link
*According to the NCDC U.S. temperatures in October 2009 was on average the third coldest in 116 years, November was the 4th coldest, and February 2010 was the 29th coldest. U.S. temperatures December '09 - February '10 were well below normal link. UK experiences coldest May temps in 15 years link , October '09 through March '10 was the snowiest on record in the northern hemisphere link
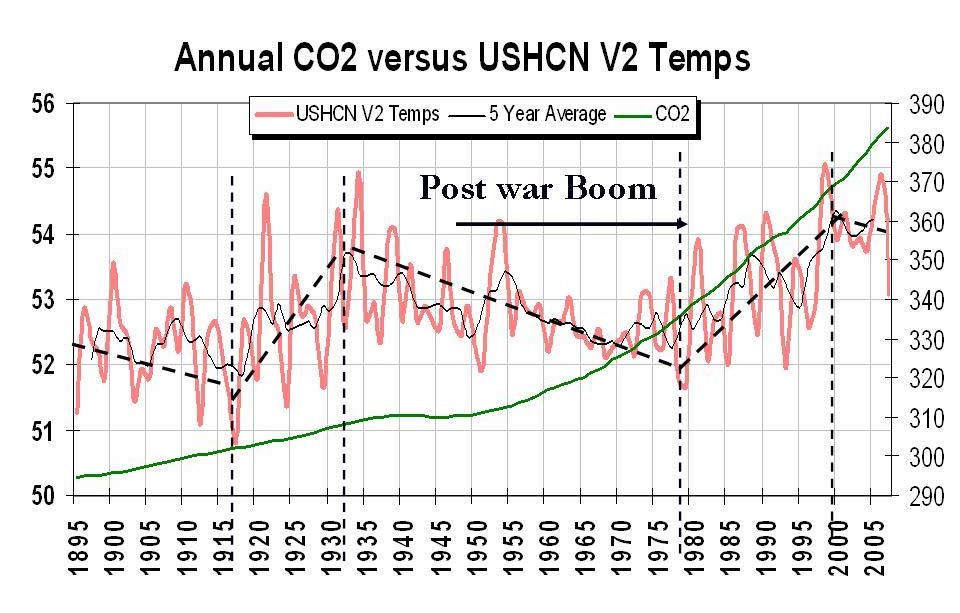
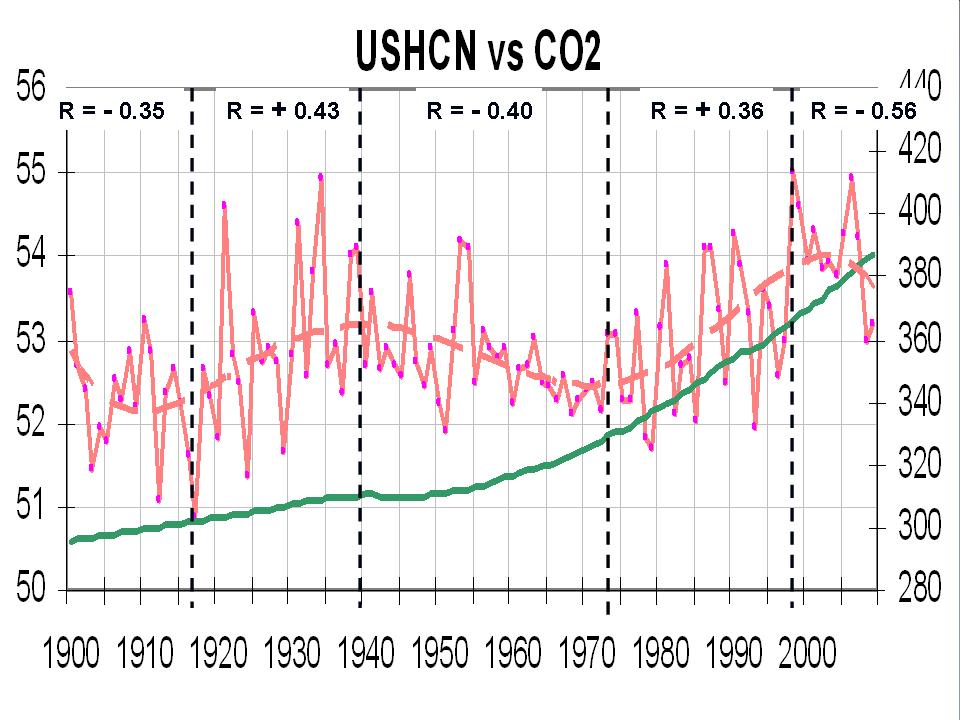
*In the U.S. temperatures cooled in five of the last seven decades even though CO2 levels increased steadily throughout this period. link link
*In February 2010, the Northern Hemisphere had the second largest area of snow coverage ever recorded link and North America had the most snow cover ever recorded. Snow coverage in the Northern hemisphere has been growing since 1998. Snow in areas where it usually does not snow can only be because temperatures are colder, and not from global warming. The additional snow was not because of higher levels of humidity, according to NCDC February '10 was the 47th driest in 116 years.
July 2010, South America experiences historic cold weather link Argentina experiences coldest winter in 40 years link
Summer 2010, record cold in Australia link
Cold weather kills 600 rare Penguins in South Africa link
In spite of all the hot weather of late, according to NOAA 62% of the continental U.S. had below normal temperatures January-July 2010
August 2010, hundreds die in Peru from record cold link October 2010, hundreds of thousands of sheep die in New Zealand from winter weather link
Early December 2010, snow impacts millions in Europe link Denmark experiences coldest November 2010 temps in 131 years link Sweden braces for coldest November 2010 temperatures in over 100 yearsl link UK midlands expect coldest November temps in 134 years link
December 2010, The central England temperature record in early December was the second coolest since records began in 1649, UK experiences coldest December in history link UK is paralyzed by blizzards. Only essential travel allowed.
Near record cold in Europe, India, and Asia link
January 2011, 7,000 buffaloes die from cold in Vietnam link Bitter cold sets records in Korea link 800,000 animals lost from cold in Mongolia link Snow flattens 100,000 homes in China
February 2011, Moscow has coldest winter in 100 years link. Record low temperatures in San Francisco and Spokane link Link Minneapolis has most snow emergency days in city's history link New York City and Philadelphia shatter snowfall records link
Winter 2010-2011 in the US, 39th coldest in 113 years of records. link link Temperatures are dropping an average of 4.1 deg F per decade link
Coldest March ('11) in Australia history link Global temperatures in first 3 months of '11 are the coolest in the past decade link May '11 Australian ski slopes to open early with early cold link Seattle has coldest April in history in 2011 link Darwin Austalia has coldest May and June 2011 temps in history link
Northern Australia has coolest May in history link Record 2011 US snowpacks threaten western states link Record Sierra Mtn snowfall link Record 2011 snowpack in Rockies link
July 2011, South America gripped by brutal winter link July 2011 New Zealand sets record for coldest day ever link Unusual snows hit South Africa in late July 2011 link
August 2011, Auckland New Zealand has coldest temperature in history, and first snow since 1939 link New Zealand worst blizzards in 50 years link
Sept '11 Minnesota has record low temperatures and tie earliest snow record linkParts of the UK have the coolest summer in 20 years, butterfly population suffers link Switzerland has record September snows link
October '11, extremely rare early snow in Germany link Earliest snows in Ireland since 1964 link New York City has largest October snow since the Civil War link Many records set for earliest snow and most snow in the northeast USA for October, millions without power link Many snow records broken in New England. link Colorado ski resorts have ealiest season opening in history link 80% of Australia cooler than normal in first ten months of 2011 link Record 2011 snow in U.S. link
November '11 British Columbia ski resort has earliest opening in its history link record Alaska snow link Russia south hit with record low temps link Northern Hemisphere has record snow cover extent for this date link Fairbanks Alaska has record low temps of -41F, 39 degrees below avg temp. link
December '11, Australia has coolest start to summer in 50 years, Brisbane coldest temps in 126 years link Alps have largest December snows in history link
The best and most accurate way to measure global temperatures are from satellites that measure atmospheric temperatures. See how atmospheric temperatures have changed since the start of measurement in 1979 link
Total global polar sea ice extent is largely unchanged over the past 30 years
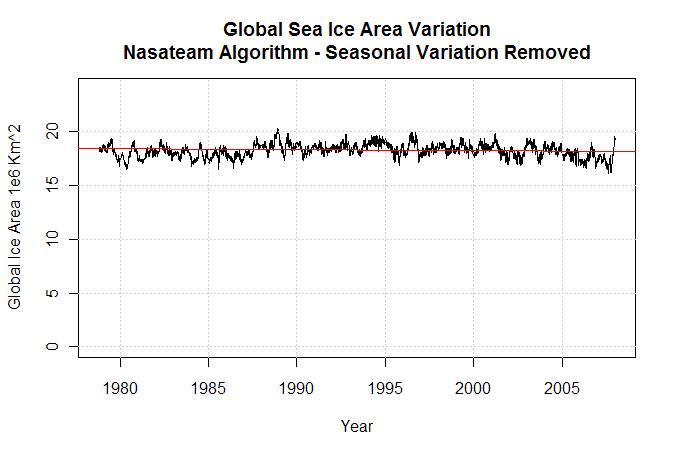
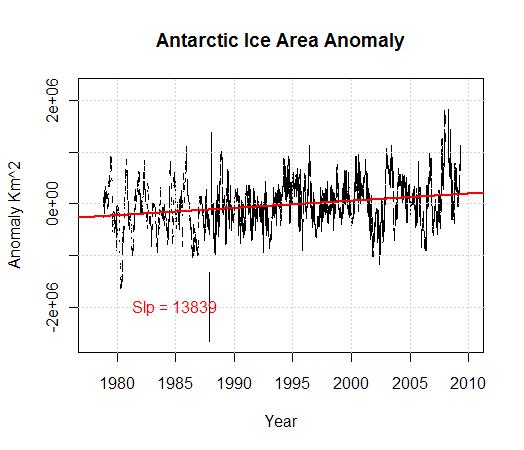
*When adding the sea ice volumes at both poles there is about the same ice as 30 years ago link. Antarctica has 90% of the world's ice and had the most sea ice ever recorded at the end of 2008, over one million square kilometers above the average maximum. The global sea ice extent today (combined sea ice at both Poles) is nearly the same as the average of the last 30 years according to NASA and NSIDC link link
View today's Antarctic sea ice extent compared to the 1979-2007 average (National Snow and Ice Data Center) link link While it is true Arctic sea ice volumes have been overall slightly less today than the average of the last 30 years the ice there has been growing the past several years and as of mid September 2009 there was 24% more ice than just two years earlier, which is over 1 million square kilometers of new ice since 2007.
There is also substantially more multi year ice in the Arctic in 2009 than just one year earlier link Antarctic sea ice extent in September 2009 is also growing and is 1 million square kilometers more than the previous year. In 2009 the Antarctic had the most Summer ice ever recorded link. The 2010 Arctic sea ice melt has started later than at any time ever recorded. Arctic ice volumes in April 2010 are the largest in nine years and are now close to the average of the last 30.View today's Arctic sea ice extent, AMSR-E link NSIDC link (Nansen) link DMI link
2010 Antarctic ice extent was the third largest ever recorded. Average snowfall in Antarctica was the most ever recorded link
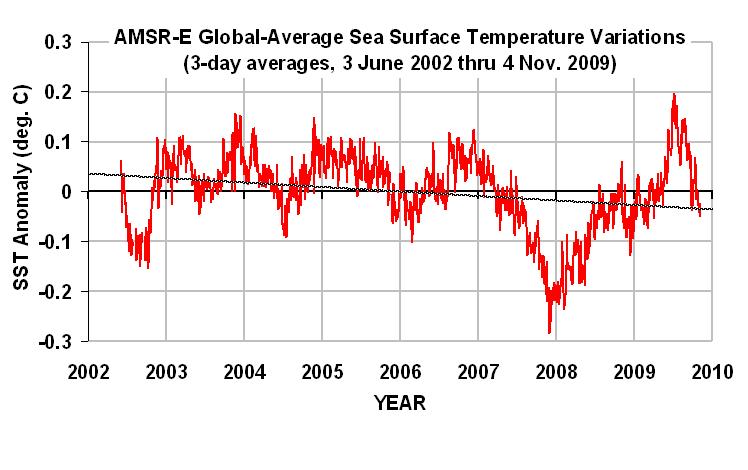
Ocean temperatures are cooling
*NSIDC/NASA AMSR-E also shows that the overall trend of ocean temperatures since 2002 is one of cooling in spite of a recent short lived El Nino warming event link
The oceans have been cooling which is contrary to climate model predictions link See how Argo is measuring ocean temperatures throughout the globe link Argo research (with its 3,300 ocean buoys) has found ocean temperatures are cooler. link link
The PDO (Pacific) is moving towards a cool period (La Nina). See current ocean surface temperatures from the NOAA link link
Track mid Atlantic storm formation here, NOAA link
Global storms and their intensity are in decline
*The trend for violent tornadoes is in decline in the US link. U.S. landfall hurricanes are less numerous and powerful than decades ago.
Global hurricane, typhoon, and cyclone activity are nearing 50 year lows according to Florida State University link
Deaths from severe weather events are in decline link
Global cyclone activity is at 33 year lows at the end of the 2010 hurricane season. Pacific storms lowest since recording began in 1945. link
There have been few hurricanes to reach US shores in the past three years which is highly unusual link
Global hurricane (tornado) activity in 2010 was at the lowest level in three decades even though 2010 was a warm year overall link
Polar Bear populations are of record size
Some say Polar Bears are threatened but there are more polar bears today than ever recorded, an increase of 300%+ since the 1950s. link link
The scientific name for Polar bears is Ursus Maritimus, which means sea bear. Polar Bears are excellent swimmers and can swim 200 miles or more link.
A Polar Bear with a radio tracking collar swam over 400 miles in 9 days and without rest link Polar bears have survived periods when the Arctic melted completely in the past (they moved to land). Polar bear face bright future link
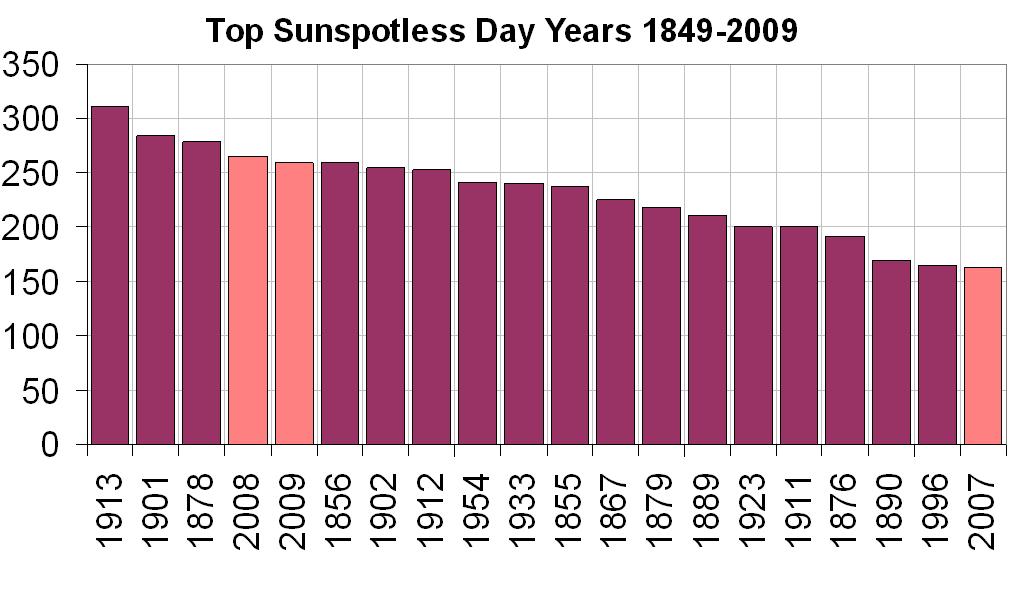
Solar activity is lower. This has led to cooler temperatures in the past
So what has changed? CO2 concentrations continue to increase yet temperatures have been falling since 2002? Polar ice is growing. Storm intensity is in decline.
One reason may be that solar activity is at the lowest level in almost a Century. link link link See what the sun looks like with and without sunspots link
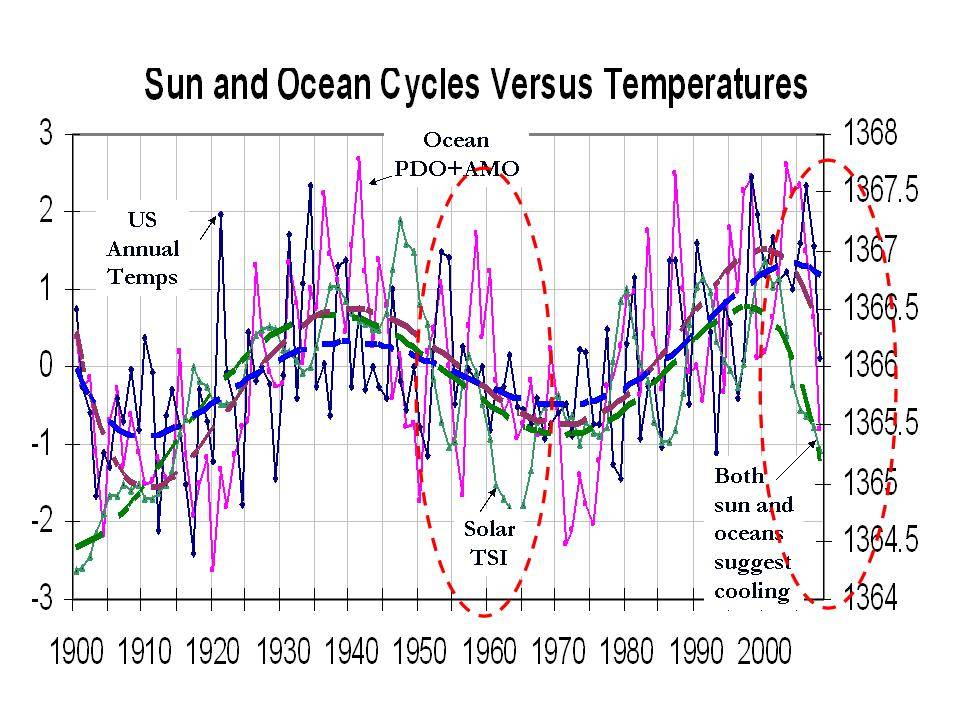
In the past periods with fewer sunspots and lower solar activity were ones with cooler temperatures. It is believed by some scientists that lower solar activity increases cloud formation and this has a cooling effect. If the past is a predictor of the future, these changes in solar activity will cause a 30 year period of cooling temperatures on earth and in fact it appears that this has already begun. See solar activity charts here link
See the combined impact of ocean and solar cycles on global temperatures link
Europe, North America and many other areas of the Earth have recently experienced a score of unusually low temperatures. So where is the global warming that we are preparing for?
Is a carbon cap and trade system that would raise hundreds of billions of dollars each year for the government necessary if in fact the slightly warmer temperatures of 1978-1998 were caused by natural forces such as the Sun's increased activity in that period, and that many scientists are now becoming skeptical of the theory of man made global warming (AGW)? link
Is the re-engineering of society to reduce CO2 emissions necessary when in the geological history of the planet warming temperatures were never preceeded by rising CO2 levels? Did you know that if this country eliminates 100% of its CO2 emissions China will replace it within in 2 years due to their high growth rate? It appears to me that the man made global warming theory is looking more and more like the Y2K scare of the late 1990s.
If you have doubts about the conventional beliefs of global warming and want to learn more please do read on.
*the use of information on this website is unrestricted and can be reproduced without permission.
Geoff Pohanka
1/12
No comments:
Post a Comment